We have performed the simulation to find the approximate RCS of the Lockheed C-5 Galaxy by breaking down the aircraft into numerous points as shown in Figure 1, and each point represents a simple shape.
 |
| Figure 1. Representations of the aircraft's structure (Note that there are some changes compared to the previous post) |
Simplifying assumptions:
1. Sphere : Point 1.
2. Cylinder : Point 2, 3, 4, 5, 6, 15 and 16.
3. Rectangular flat plate : Point 11, 12, 13, 14, 21, and 22.
4. Rectangular dihedral corner : Point 7, 8, 9, 10, 17, 18, 19 and 20.
The MATLAB program was as shown in Figure 2, 3 and 4:
 |
| Figure 2. |
 |
| Figure 3. |
 |
| Figure 4. |
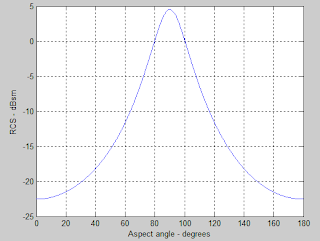
The results obtained from the simulations were as shown in Figure 5 and 6:
 |
| Figure 5. Simulation result with 3.75 MHz frequency. |
 |
| Figure 6. Simulation result with 50 MHz frequency. |
The results shown in Figure 5 and 6 was similar to the typical RCS diagrams. A more accurate result was given by the simulation with higher frequency, because higher frequency provides higher resolution of the RCS contribution by each components. The largest magnitude of RCS or ‘spikes’ were normally produced by the structure’s extremities, such as the tip of the wing.
However, the accuracy of this results was not able to be verified, since the real RCS values of most military aircrafts were kept secret from the public.
Furthermore, our simulation was performed with a lot of simplifying assumptions in terms of the shapes and the aircraft's dimension (most of the length of each components were just a rough assumptions). Needless to say, there might be some mistakes in our calculations and program codes.
Nevertheless, this mini project gave us a very good understanding of the basics of RCS and the insight of radar's operating principle. It is our fervent hope that one day we could perform a proper RCS simulation and perhaps pursue our future career in radar engineering.


